Question on 5.c in the DQN project.

Question on 5.c in the DQN project.

par Yiyang Feng,
Nombre de réponses : 3

Hi,


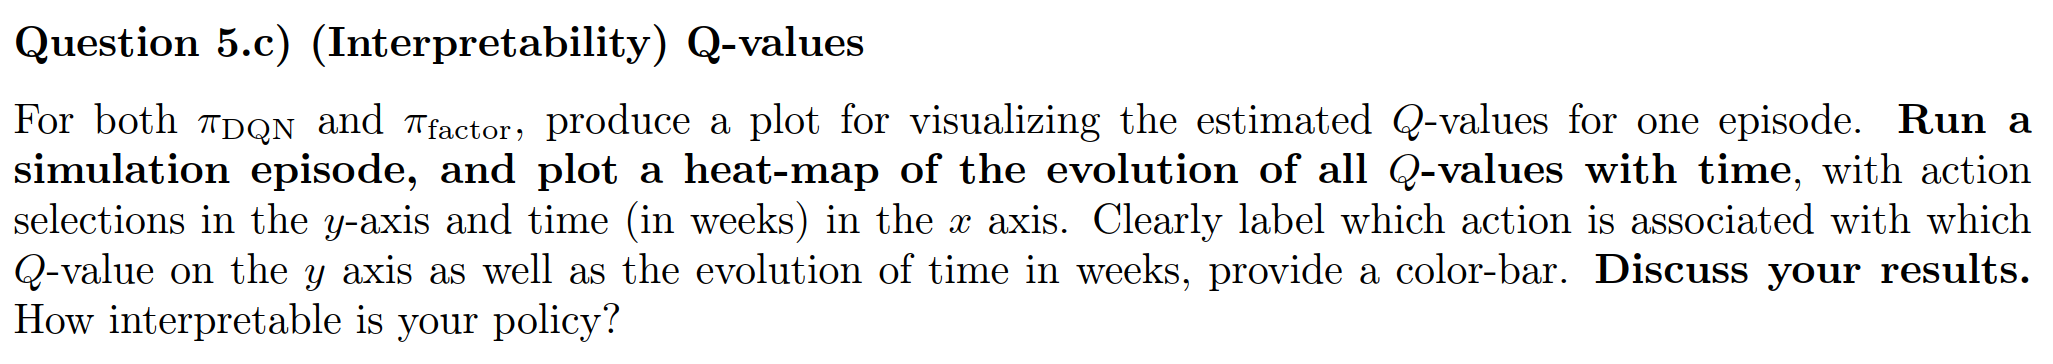
I have a question about 5.c. I have no idea what the heatmap of Q-values looks like because Q-value is a function of both states and actions. But the y-axis is only the actions selected. I am confused about what the visualization looks like.  

Thanks in advance,

Yiyang

En réponse à Yiyang Feng

Re: Question on 5.c in the DQN project.

par Titouan Alexis Arthur Renard,

The Q-network approximates the Q-value for all actions given an observation from the environment (this is a feature vector that contains information about the state). Here we ask you to plot the Q-values estimated for each actions at each time-step in an episode. Each time step is associated with a state - and with an observation of that state which is passed to the neural network - hence your states are on the x axis while your actions are on the y axis.

En réponse à Titouan Alexis Arthur Renard

Re: Question on 5.c in the DQN project.

par Yiyang Feng,
Thank you, but I'm still confused. The document says the time step is on the x-axis, not the states. Also, states are multi-dimensional observation vectors so I don't know how to represent them on the axis. I really feel hard to imagine what the plot looks like.
En réponse à Yiyang Feng

Re: Question on 5.c in the DQN project.

par Titouan Alexis Arthur Renard,

At each time t, on the x axis you get a state, you then plot the actions for that at that time on the y axis. You don't plot all states you just plot the ones that happen in the episode.