Hi,
I wanted to ask regarding the page limit of 5 pages. I find it almost impossible to adhere to this limit if I am going to show plots for each task. This is what I plotted for Agent 1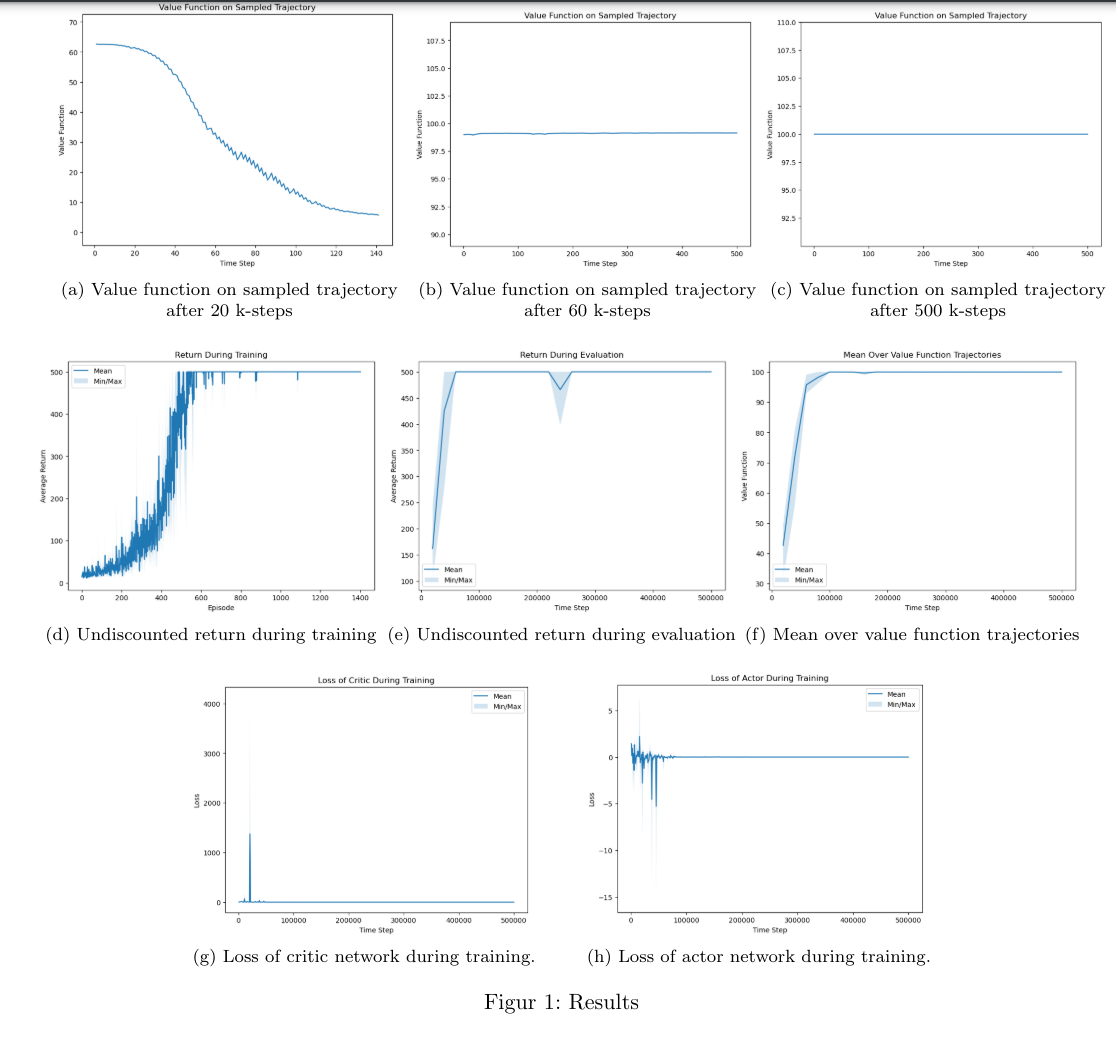
If I do this for when we add stochasticity, for K=6 & n=1, for K=1 & n=6, for K=n =6, and similarly for the continuous environment, I think only the plots will take 5 pages or more. For which agents are we expected to provide plots? And how do we reconcile this with the max page limit?
One plot can contain more than one curve. You can keep this nice plotting structure and for each plot add the curves of all the agents.
I will add a few remarks here that can improve the plots:
- be careful with the x-axis of (d). What is asked in the project description?
- (g) can you read anything?
- (h) is a bit more readable than (g), but still doesn't show much.
Hi, thank you for the great response.
Regarding d) we store all episode returns, just to get more resolution/granularity, than logging for every 1k. What is wrong here, just that we should use the number of steps as the value for x-axis, like for some of the other plots?
Or are you referring to "plot the evolution of the average undiscounted trajectory return throughout training." I am not exactly sure what this means, what are we averaging over?
"Regarding d) we store all episode returns, just to get more resolution/granularity, than logging for every 1k. What is wrong here, just that we should use the number of steps as the value for x-axis, like for some of the other plots?"
Yes exactly.
Yes exactly.
En réponse à Skander Moalla
Re: Page limit for project (MP2)
Hi, just to jump in on the topic: is it okay if we include all our plots in an appendix, and simply refer to the plots in the actual report when they're relevant? That way, we include everything and don't have to make the plots too small or hard to read.
En réponse à Alexei Ivan Nicolai Igor Ermochkine
Re: Page limit for project (MP2)
par Skander Moalla,
Some summary plots to support your conclusions/results should at least be in the main paper.
The appendix can be used for additional details but should not be expected to contain the main results.
The appendix can be used for additional details but should not be expected to contain the main results.
So I've sat with this for a while now, and have concluded that if I want to plot the return for each episode (thus having higher granularity/resolution), it is almost impossible to do with X-axis of time steps, at least if you are going to work with multiple seeds, and plot with min/max. Say we have 3 workers on one seed that finish the first episodes after [100,200,300] steps with returns [10,20,30]. Then you could say that we reach an average of (10+20+30)/3 = 20 reward after 100 +200+300 =600 steps. Another seed might instead have first episode lengths [300,300,300] with returns [30,30,30], thus an aver of return 30 after 900 steps. That is you will have a seed where the first episode ends after 600 steps (total of all 3 workers) with avg reward 20, and another seed where the first episode ends after 900 steps (total of all 3 workers) with avg reward 30. The problem here is that you cannot plot what we are asked with min and max because the first episode happens after 600 steps for one seed and after 900 steps for the other so they are not aligned.
This is easily solved by just counting episode by episode (no matter the length for every seed) and plotting like we did in d). My point is, why does it matter that we have the x-axis as the number of steps? In fact I could just take the reward of the last episode after logging every 1 k, and plot that evenly, with the x-axis as time step. However, I will lose the resolution that of seeing the results after episode, and if anything I think my current plot d) gives more information as is.
Not sure if you understand my example, but hopefully you could clarify why we want to plot the x-axis as the number of steps in this case. Do you want us to just pick out one episode/reward value per 1k steps even if multiple episodes have finished during that 1k?
Thanks for the details! The idea of plotting environment steps and not episodes in the x-axis of the returns is that episodes vary in length. So if 2 different agents A1, A2 reach returns R1 > R2 you cannot tell if A1 learned on more time steps or did more gradient updates than A2 if you have the episodes in the x axis.
The idea is to always compare the agent on the same training budget counted as the number of environment steps used for training.
Now your concern is valid, this becomes tricky for training with multiple seeds. The tradeoff is between respecting the granularity of each run and at the same time aggregating this in a meaningful way.
Here's what you should do, and we will send a clarification comment in a separate post to everyone.
For each individual run, you should log the returns as soon as episodes finish with their termination/truncation timestep (for each worker independently, unless they finish exactly at the same time and you take the average) as mentioned in the project description.
When you aggregate all the seeds together, you have to take a window, the window of 1k mentioned in the project description, but you do not first aggregate inside each run as you did in your example (there is no average inside a single run, unless workers finish a the same timestep). You take all the returns from all the seeds generated during this window, this forms your population, and from there you have a min, a max, and a mean for the N*1k step.
Hello, one other thing we noticed is that in a window of 1k steps, it is not necessary that any episode has finished. This will depend on K. If we for example take K=6 and n=1 and each worker takes one step, it could be the case that all workers have done well (this will happen in the end of the training loops) and each worker gets to step ~167. So we have neither reached termination and truncation. Then there is not really anything to log, since episode has concluded. This will be even more apparent in the continuous environment which truncates at 1000 steps.
The easiest fix to this is to let the log interval be dependent of K, and at least K*(steps until truncation), so for the cartpole K*500. This way we ensure that each worker will finish at least one episode before we log. What do you think? Should we do this? Or have we missed something? Thanks again for the answers!
The easiest fix to this is to let the log interval be dependent of K, and at least K*(steps until truncation), so for the cartpole K*500. This way we ensure that each worker will finish at least one episode before we log. What do you think? Should we do this? Or have we missed something? Thanks again for the answers!
Hello,
Sorry for the delay. I missed this comment. No, you should not change the logging interval. It's fine if there is no return to report on a given timestep. It will be reported at some point.
Sorry for the delay. I missed this comment. No, you should not change the logging interval. It's fine if there is no return to report on a given timestep. It will be reported at some point.
One thing I also would like to add, is that plotting several of the agent plots in the same figure is not very convenient when working with multiple seeds, and where we plot with shading using min and max:
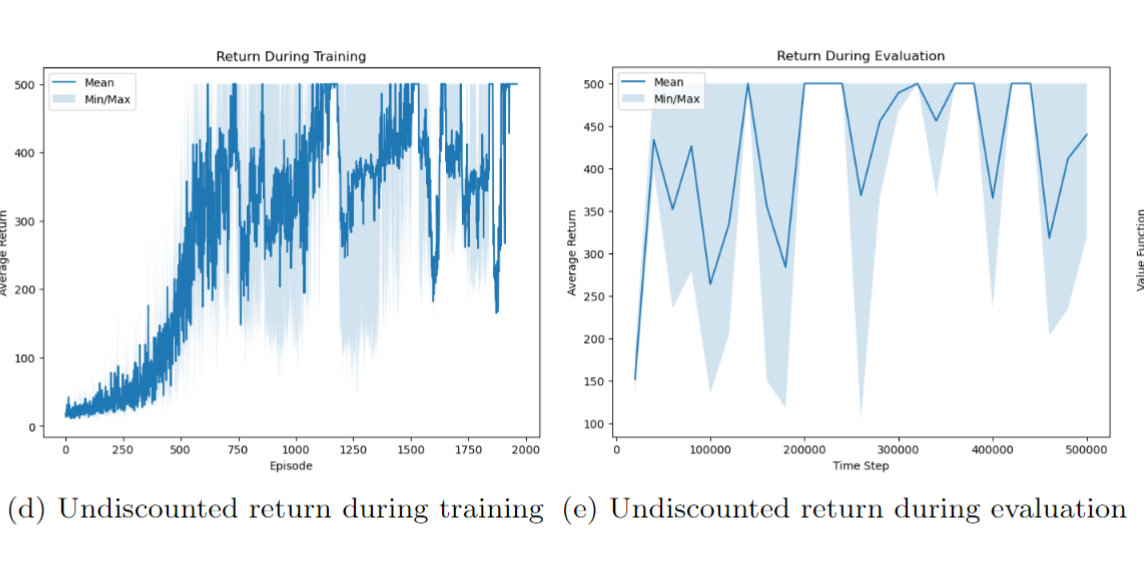
I believe that having 6 agents in each of these will be very tough to interpret with all the shading. In the end I think it will be the case that we have very small and unclear plots just to fit the 5 page limit...
I believe that having 6 agents in each of these will be very tough to interpret with all the shading. In the end I think it will be the case that we have very small and unclear plots just to fit the 5 page limit...
With the clarification of the previous question, they should look nicer. In addition, you can implement some form of smoothing and mention its implementation details in your report.
You can also separate these in two 2 (Figure 1 you attached x2) where you would split them in a meaningful way.
You can also separate these in two 2 (Figure 1 you attached x2) where you would split them in a meaningful way.