Hello everyone,
I guess the question is for every students of the course!
Does anyone has succeeded doing the software profiling and can help the ones who don't with a zoom call?
Please help us! We will be very grateful!
Thanks a lot for your help,
Have a good day!
Actually I'm having the same difficulties.
I have found this link, where it is described, what has to be done to use gprof with my own nios2 project.
https://www.intel.com/content/www/us/en/programmable/support/support-resources/knowledge-base/solutions/rd07132004_7740.html
But I haven't gotten it to work so far. So I enabled the gprof profiling in the settings.bsp file in my bsp folder by setting the value to one, then added the -pg compilation flag to the other project. I regenerated the bsp, cleaned everything and recompiled everything. Then I can load the program onto the development board, but then the program doesn't even seem to start at all.
Might it be a problem, that we have to provide a system clock that calls the alt_tick on an interrupt?
Would be nice if somebody could provide a step by step guide what one has to do to use gprof with own bare-metal c project in eclipse.
Thanks
Dominic
In reply to Dominic Robert Heinrich Hagmann
Re: Software Profiling, please HELP!
Hi everyone,
I've seen a few people with issues getting their gmon.out file generated. Here are the steps I took to get the file on my machine (I'm using the VM provided in the course):
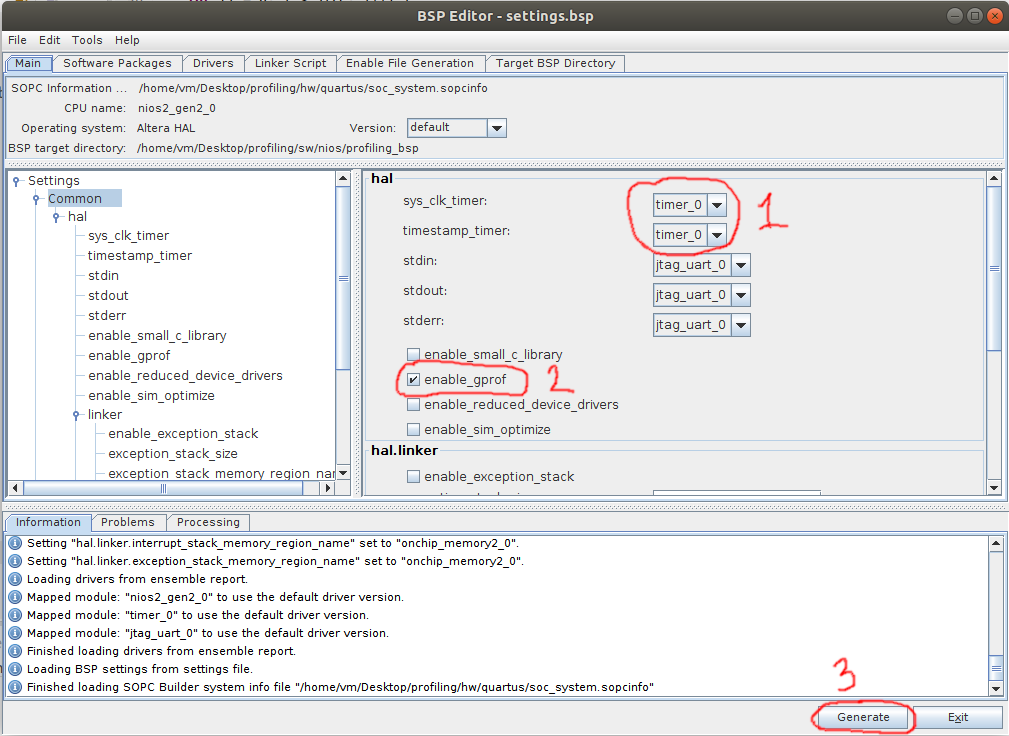
The first thing to do is to enable the sys_clk_timer and timestamp_timer in the BSP editor, then to enable gprof itself.
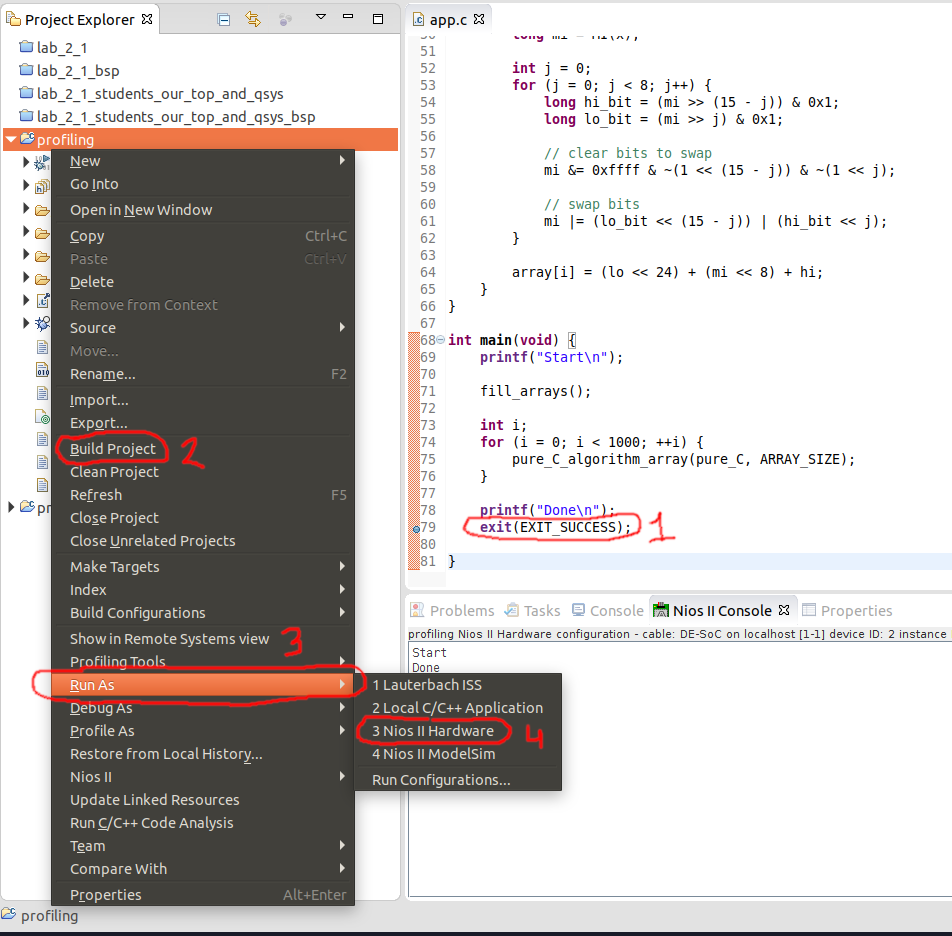
You need to ensure that there is an exit() function in your source code, and definitely not a call to "return" as the profiler will use the exit status of the main() function to decide when to output the gmon.out file. Don't forget to build the code, and to RUN the binary (do not debug it).
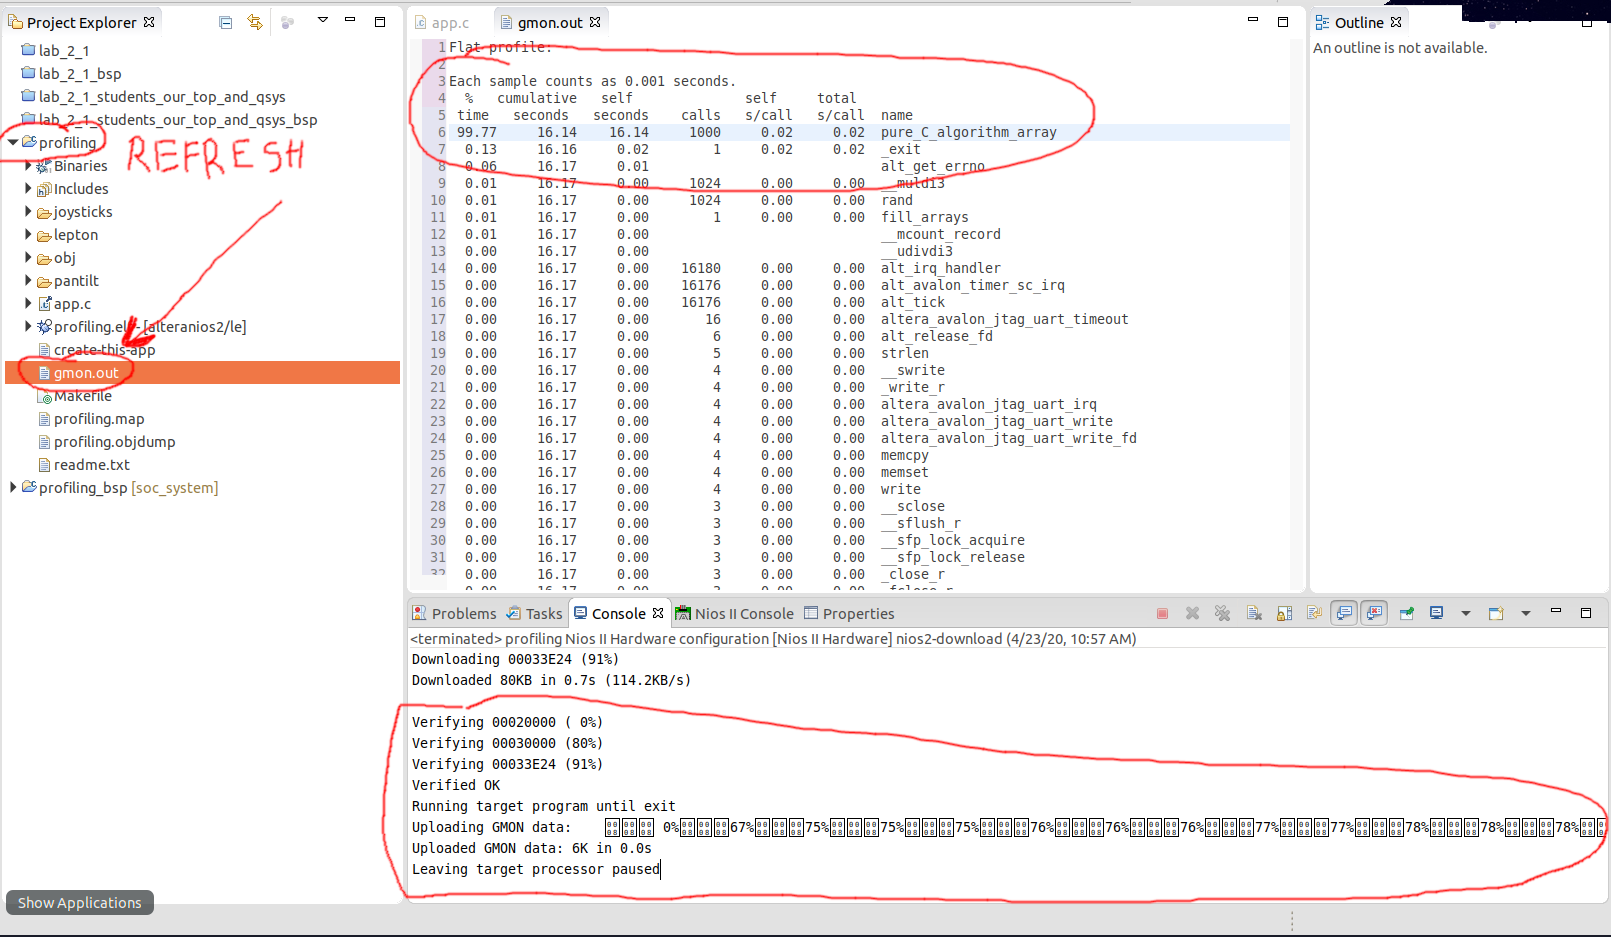
Once your program finishes running, you should see the console saying that the gmon.out file is being uploaded to the host machine. You will not see it directly in eclipse as eclipse does not refresh the navigation pane. Just right-click on the project and say "refresh", then you should see the gmon.out file appear. You can double-click on it to view the profiling results of the application.
I hope this helps get everyone back on track with their profiling.
Sahand
In reply to Sahand Kashani-Akhavan
Re: Software Profiling, please HELP!
Thank you very much for your answer.
It has worked now :D
Seems like it still doesn't work for me. I guess I have another problem maybe so it would be very good to make a call for me if it is possible.
Best,
Lucas
Best,
Lucas
I'll send you an email so we can find a time.
Ok folks, it turns out profiling works well on linux, but is flaky on Windows when done through the Nios IDE. What you can do is instead to just compile your code in the IDE, then launch the code downloading procedure and gprof invocation in a nios command shell instead.
You can find the nios command shell in the windows start menu. You should then change the working directory to where your eclipse project is stored and execute the following instruction:
nios2-download -g --write-gmon gmon_0.out *.elf && nios2-elf-gprof *.elf gmon_0.out > report_0.txt;
The first command (before the "&&") writes your binary program to the CPU's memory and instructs it to read back the gmon file once it's written. The second command processes the gmon file and outputs a report in a text file called "report_0.txt" which you can then open with a text editor to see what your system is spending time on.
Beware that the command in a CLI also fails occasionally, but you can just push ctrl+c to halt it and relaunch it immediately afterwards. It tends to work without issue if tried 1-3 times.
Thank you very much!
In reply to Sahand Kashani-Akhavan
Re: Software Profiling, please HELP!
Hi,
Thanks for the detailed explanations, it's really helpfull !
However, it still doesn't work for me, the profiler seems to hang indefinitely at this step :
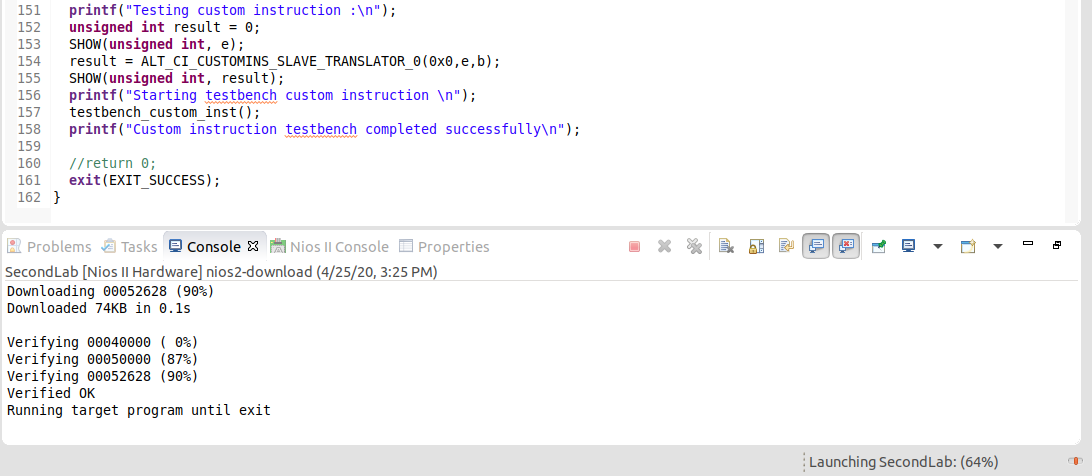
It's really weird because my code runs instantaneously when the profiling is not enabled.
I know it's supposed to be longer with profiling enabled but I only have twice 1000 bitshift operation (C code and custom instruction) and it's been hanging for more than half an hour, I don't think it's supposed to be that much longer.
For information, here is my quartus configuration, am I missing something ?
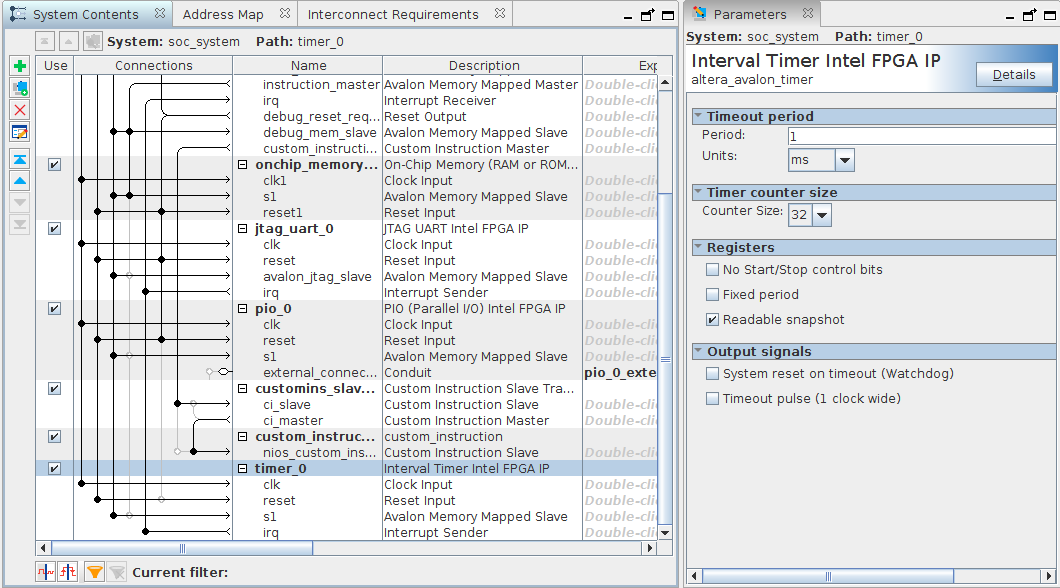
The only thing above is the clock and the Nios processor. The timer is in ms.
Did anyone encountered that issue of the profiling hanging forever ? I didn't try too many time as I always have to restart the full virtual machine and battle quartus to make it download on the FPGA and it always takes a lot of time but out of the 4 times I tried it always hanged at the same point.
Thanks for your help, it's really appreciated,
Regards,
Sylvain
EDIT : My computer is running linux and I'm using the virtual machine provided in the course
Hello,
Have you tried the command line given by Sahand?
Have you tried the command line given by Sahand?
Hi,
Thanks for your suggestion !
I thought it was only for windows ? Did you used it to solve a similar issue ?
Anyway, you're right, i'll give it a try.
Regards,
Sylvain
Hi Lucas,
Thank you a lot for your advice, i managed to make it work !
For reference if others have the same issue, here is what worked for me (I don't know if all the steps are absolutely necessary ^^):
- First run the program in debug mode, (and check that the exit(EXIT_SUCCESS) is reached)
- Activate the gprof in the bsp option window
- generate bsp
- build project
- open a new command line, navigate to the folder of your application code and run Sahand command line
Hope it works for you too !
Cheers,
Sylvain
I have gotten this problem too and it seems to be a recurent problem for most people. If you don't want to use the command line and you use linux, try first to debug your code multiple time until it works (if it don't, try to put some break point). When the debug reach finally the end of your code, you can then try to run it and it should work (maybe run it with the same configuration you used for the debug). After this, just refresh the project and (if you use linux) the gmon.out file will be generated.
I advise you to use the NIOS command shell and the command line given by Sahand, the steps are easier until you get your files correctly (if you don't succeed with the command line, tell me and I can show you how we have done it with Sahand this morning for me).
I advise you to use the NIOS command shell and the command line given by Sahand, the steps are easier until you get your files correctly (if you don't succeed with the command line, tell me and I can show you how we have done it with Sahand this morning for me).
Sorry, I replied too fast to your previous message, thanks for the complementary informations I will do that for sure!
I'll try again this afternoon and I'll let everybody know which steps worked for me if I succeed !
Regards,
Sylvain