Thanks for answering the question, I'll add some more details :)
1) I'll give an example to illustrate the point further. Let's say that we are trying to classify the following data points with the labels:
X = np.array([[0,0.5,1,6,8,10]]).T
y = np.array([[-1,-1,-1,1,1,1]]).T
It's a dataset of how many hours per week students spend studying for Intro to ML. The labels are -1 if they don't study enough, and +1 if they study enough. I'll first try to predict the labels using linear regression.
w = np.linalg.inv(X.T@X)@X.T@y
y_pred = w@X.T
print("before thresh", y_pred)
>> before thresh [[0. 0.05590062 0.11180124 0.67080745 0.89440994 1.11801242]]
Since linear regression predicts continous values, we'll have to threshold this. I set a threshold at 0.5 (eyeballed), anything less than this will be labelled -1, more than this will be labelled +1.
After thresholding, my prediction is:
after thresh [[-1. -1. -1. 1. 1. 1.]]
As for logistic regression on the same data:
clf = LogisticRegression().fit(X, y[:,0])
y_pred = clf.predict(X)
print(y_pred)
>>
[-1 -1 -1 1 1 1]
So both algorithms work (for now). Now let's add a new student to this dataset, who studies 40 hours per week (wow!)
X = np.array([[0,0.5,1,6,8,10,40]]).T
y = np.array([[-1,-1,-1,1,1,1,1]]).T
Our linear regression results are:
[[0. 0.01734906 0.03469813 0.20818876 0.27758501 0.34698126 1.38792505]]
If I keep thresholding at 0.5:[[-1. -1. -1. -1. -1. -1. 1.]]
So we actually have to move our threshold, otherwise the poor students who study 6,7,10 hours would be classified as "not enough". I move the threshold to 0.2.
[[-1. -1. -1. 1. 1. 1. 1.]]
So it still works, but we had to adjust our threshold due to the outlier. This in itself is not nice. If I have a test data now of a student who studies 5 hours, linear regression gives result 0.17 which is below the threshold of 0.2, and would get classified as "not enough" (seems a bit unfair).
Whereas this outlier did nothing to logistic regression's performance, and we didn't have to tune any threshold. In fact, the classification results are:
[-1 -1 -1 1 1 1 1]
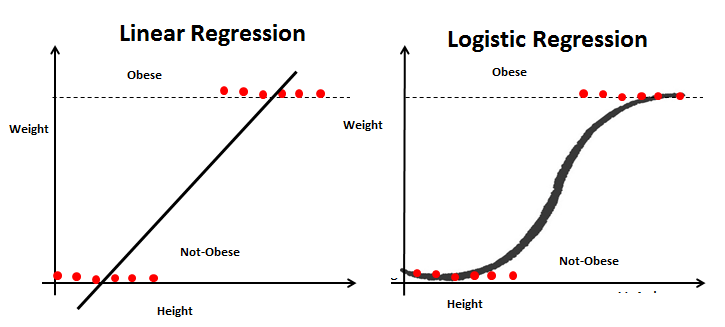
So what happened? With linear regression, we tried to fit a line to the data, which was greatly influenced by the outlier. With logistic regression, the sigmoid function comes to our rescue. Here's a figure the illustrate this:
2) Each pixel is annotated with 0 and 1, as the previous reply pointed out. This means that each data point can be treated as a sample (we can engineer some features for it, such as the pixel's RGB values, maybe the pixel's neighbour's RGB values, etc.) with a label of 0 or 1.
What you suggested is also correct by the way, you can feed the images to a CNN to extract per pixel features instead of engineering them by hand, then feed these enhanced data samples to a logistic regression model. Or even better, you can use the CNN for the end task as well: directly get the classification results. You might remember that this is what happens with UNet.
Best,
Sena