Question about the Rainfall vs S-Ne plot interpretation

Question about the Rainfall vs S-Ne plot interpretation

par Thomas Castaldi,
Nombre de réponses : 3

Hello,
I have some difficulties to understand the last graph of Lab2.
First of all I don't understand what S-Ne represents and this even by looking at help(clouds).

The documentation tells us that this is a suitability criterion, but that doesn't really help me to interpret the graph...

Can you explain to me what this variable corresponds to?

Thanks in advance

En réponse à Thomas Castaldi

Re: Question about the Rainfall vs S-Ne plot interpretation

par Hsin-Ping Wu,
Hi,
If you want to know more about the data set, type "?clouds" in the console and it will show the help page. You can take a look at the source paper if you want more information. It's also here:https://rdrr.io/cran/HSAUR3/man/clouds.html
If you want to see the data in a spreadsheet, find "clouds" in the "environment", which should be in the top right panel of your R studio.
Click on it and it will open the table on the left side.
You can also use "str(clouds)" command in the console to see the type of each column (variable).
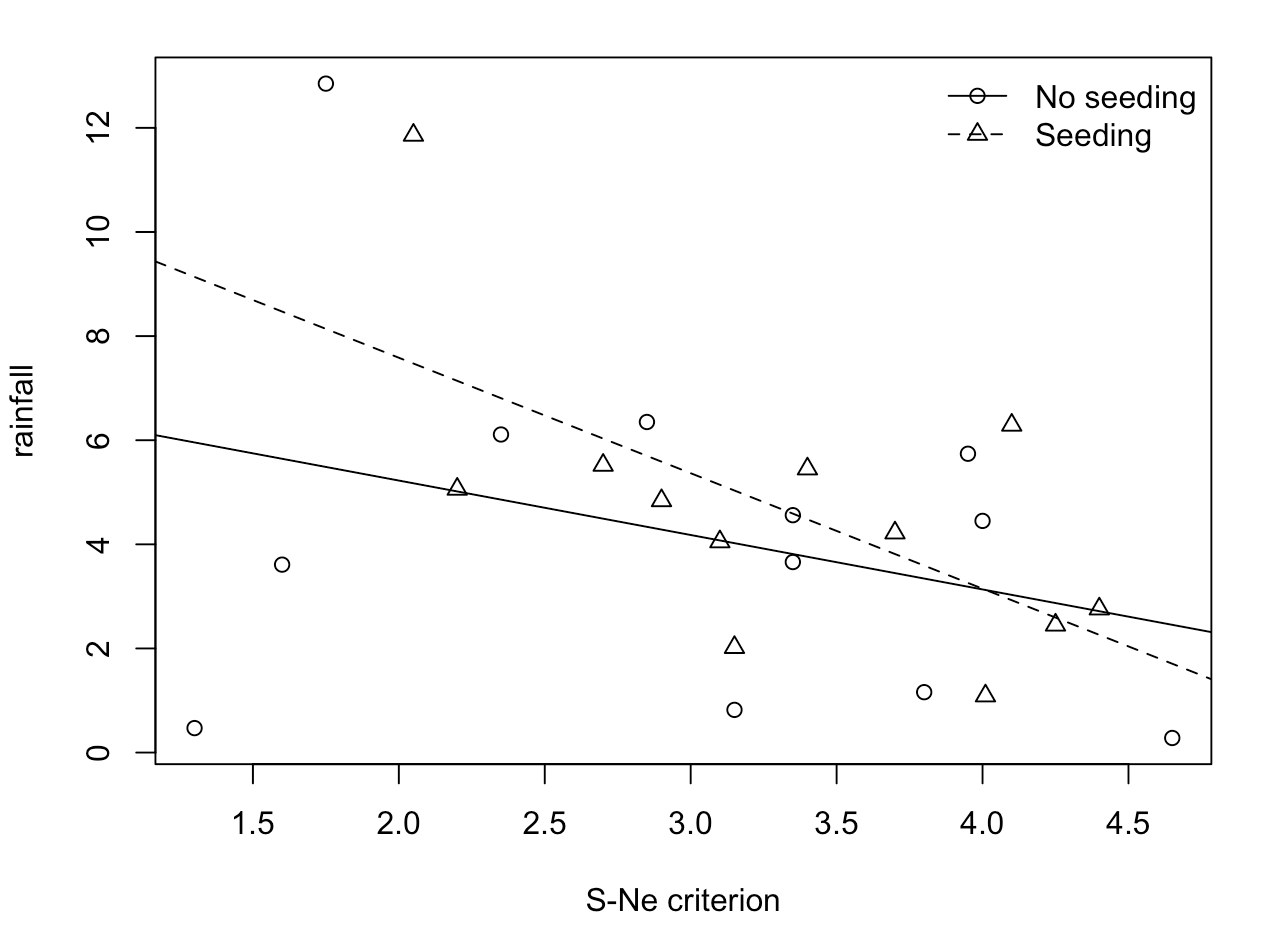
It shows that sne is a "num" (numeric) variable. "rainfall" is also a "num", supposedly the amount of rain.
To make a statistical interpretation, you don't really need to know what SNE means and how it was measured.
From the graph, you just need to understand when SNE goes up by X amount, how much rainfall increases or decreases, in the cases of seeding and no-seeding.
Check the "simple linear regression" part in the lecture slides.
If you still have questions, feel free to ask us TAs in lab session or ask Darlene during office hour.
Hope this helps!
En réponse à Thomas Castaldi

Re: Question about the Rainfall vs S-Ne plot interpretation

par Darlene Goldstein,
hello, the 'suitability criterion' is from a weather model (you can have a look at
https://journals.ametsoc.org/view/journals/apme/21/2/1520-0450_1982_021_0139_rrotfa_2_0_co_2.xml?tab_body=pdf
if you are interested in more details.

You can see in the graph that for most values of S-Ne, there is a higher rainfall for seeded clouds than unseeded clouds.

Clear??

Best regards,
Darlene