R-Table

R-Table

by Anar Sabuxi Oglu Rzayev -
Number of replies: 2

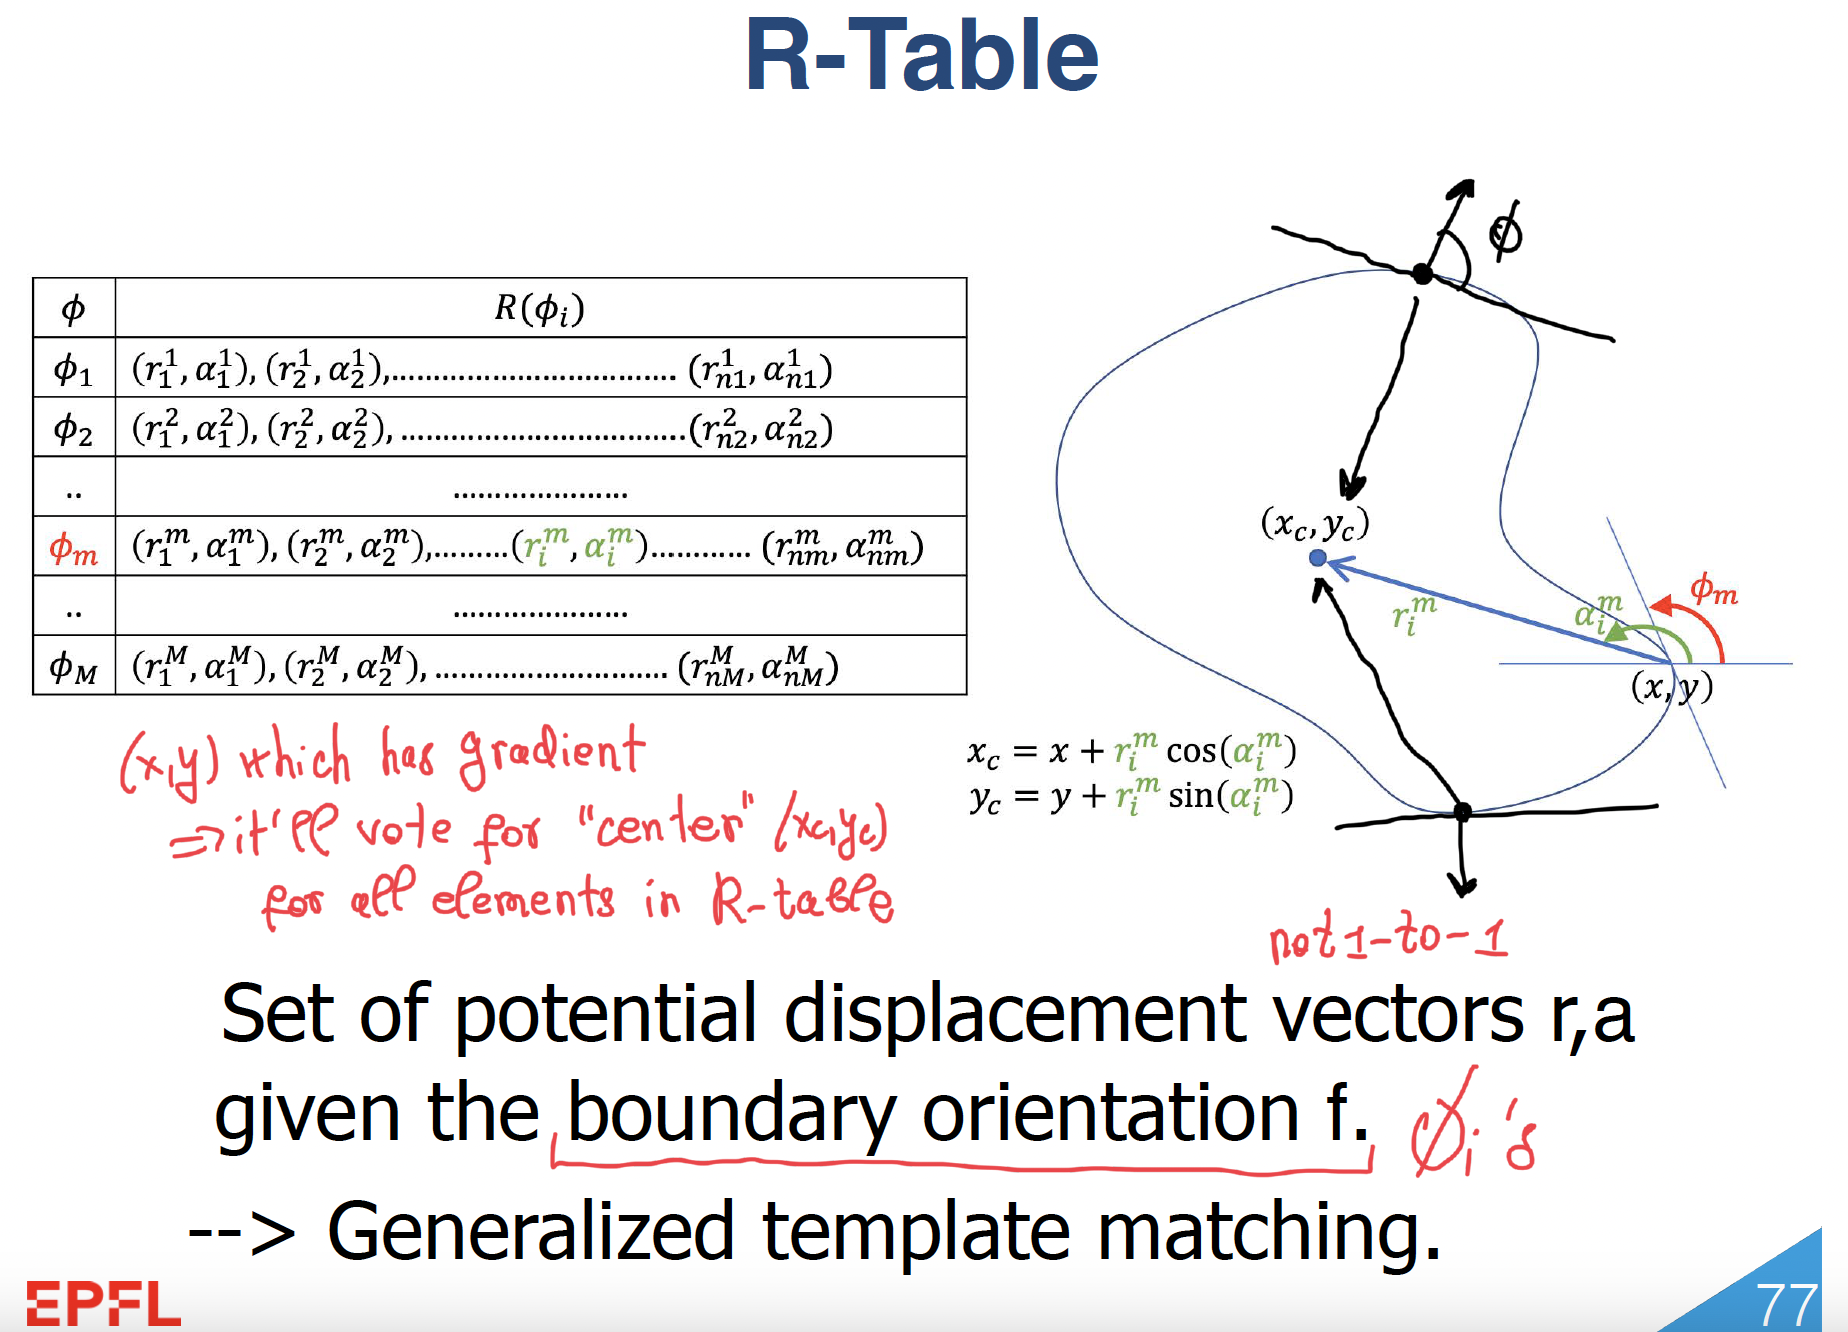
I wanted to ask a question about the R-table. I understood how the edge points (x, y) will vote for the reference point (x_c, y_c) where the "center" satisfies the relationship between x, y, r_{i}^m, and \alpha_{i}^m for different \phi values. What I can not understand is what are the other values in each of the given table's rows. Does this mean in order to create an R-table, one has to generate such many (r, a) tuples instead of just having one $\left(r_i^m, \alpha_i^m\right)$ for some $\phi_m$? Also, what does "template matching" mean in this context? Thanks in advance!


In reply to Anar Sabuxi Oglu Rzayev

Re: R-Table

by Chen Zhao -
Hi,
1. Note that given an edge direction $\phi_m$, there could be multiple edge points (x, y). That's why there could be more than one (r, a) tuples for each $\phi_m$.
2. The template here means a specific pattern in an image. For example, imagine that the task is to detect a car in a query image and you have some reference images of the car. These references are used as templates to find out a region in the query that contains the car.
Best,
Chen
In reply to Chen Zhao

Re: R-Table

by Anar Sabuxi Oglu Rzayev -
Hi Chen,

Thank you for your reply! Just want to clarify your answer: (i) So, given the possible edge direction $\phi_m$ from all possible $\phi$'s, we go along the boundary of the figure, pick edge points (x, y) which will yield tuples (r, a) and vote for the center (x_c, y_c) parameterized by the equation given in the slide. And finally, we insert all those (r, a) tuples in our R-table $\phi_m$ row.
(ii) Gotcha, thanks ~